
使用 Prometheus 直方图
使用 Flux 查询和转换存储在 InfluxDB 中的 Prometheus 直方图指标。
直方图 抽样观测值(通常是请求持续时间或响应大小之类的内容),并在可配置的存储桶中对其进行计数。它还提供所有观测值的总和。
Prometheus 数据中的直方图指标示例
# HELP example_histogram_duration Duration of given tasks as example histogram metric
# TYPE example_histogram_duration histogram
example_histogram_duration_bucket{le="0.1"} 80
example_histogram_duration_bucket{le="0.25"} 85
example_histogram_duration_bucket{le="0.5"} 85
example_histogram_duration_bucket{le="1"} 87
example_histogram_duration_bucket{le="2.5"} 87
example_histogram_duration_bucket{le="5"} 88
example_histogram_duration_bucket{le="+Inf"} 88
example_histogram_duration_sum 6.833441910000001
example_histogram_duration_count 88
以下示例包括从 InfluxDB OSS 2.x /metrics 端点收集并存储在 InfluxDB 中的示例数据。
Prometheus 指标解析格式
查询结构取决于用于抓取 Prometheus 指标的 Prometheus 指标解析格式。 在下面选择适当的指标格式版本。
在 InfluxDB 中可视化 Prometheus 直方图
InfluxDB 目前不支持将 Prometheus 直方图指标可视化为传统直方图。 现有的 InfluxDB 直方图可视化 与存储在 InfluxDB 中的 Prometheus 直方图数据的格式不兼容。
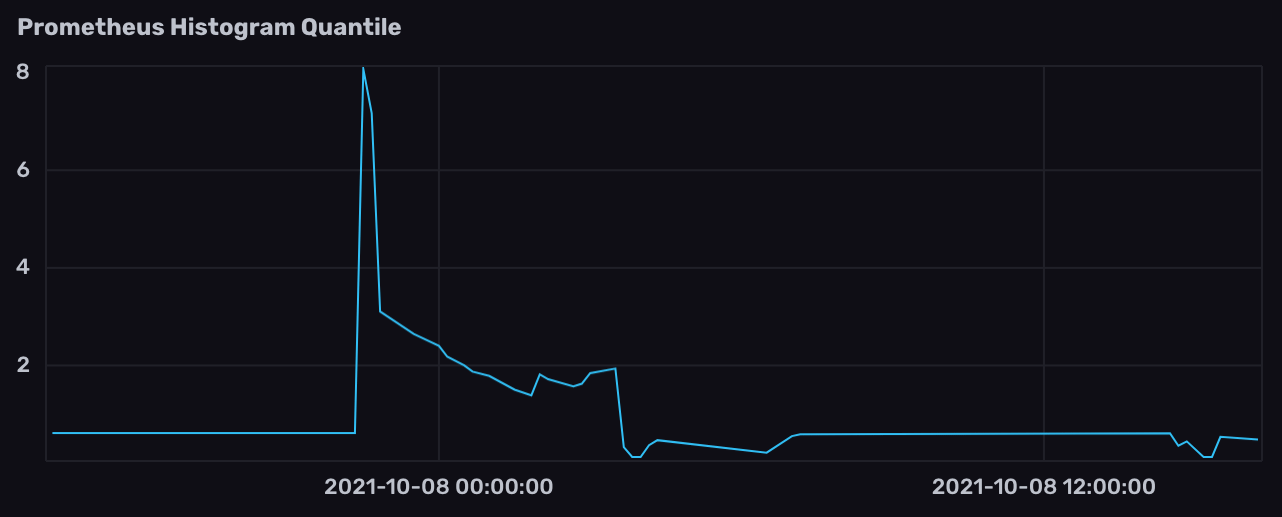
从 Prometheus 直方图计算分位数
- 导入
experimental/prometheus包。 - 按
prometheus测量和直方图指标名称字段过滤结果。 - (推荐)使用
aggregateWindow()对数据进行降采样并优化查询。 - 使用
prometheus.histogramQuantile()计算特定分位数。
import "experimental/prometheus"

from(bucket: "example-bucket")
    |> start(range: -1h)
    |> filter(fn: (r) => r._measurement == "prometheus")
    |> filter(fn: (r) => r._field == "qc_all_duration_seconds")
    |> aggregateWindow(every: 1m, fn: mean, createEmpty: false)
    |> prometheus.histogramQuantile(quantile: 0.99)
- 导入
experimental/prometheus包。 - 按直方图指标名称测量过滤结果。
- (推荐)使用
aggregateWindow()对数据进行降采样并优化查询。 将createEmpty参数设置为false。 - 使用
prometheus.histogramQuantile()计算特定分位数。 将metricVersion指定为1。
import "experimental/prometheus"

from(bucket: "example-bucket")
    |> start(range: -1h)
    |> filter(fn: (r) => r._measurement == "qc_all_duration_seconds")
    |> aggregateWindow(every: 1m, fn: mean, createEmpty: false)
    |> prometheus.histogramQuantile(quantile: 0.99, metricVersion: 1)
将 createEmpty 设置为 false
当使用 aggregateWindow() 为 prometheus.histogramQuantile 降采样数据时,将 createEmpty 参数设置为 false。 从 aggregateWindow() 生成的空表会导致以下错误。
histogramQuantile: unexpected null in the countColumn
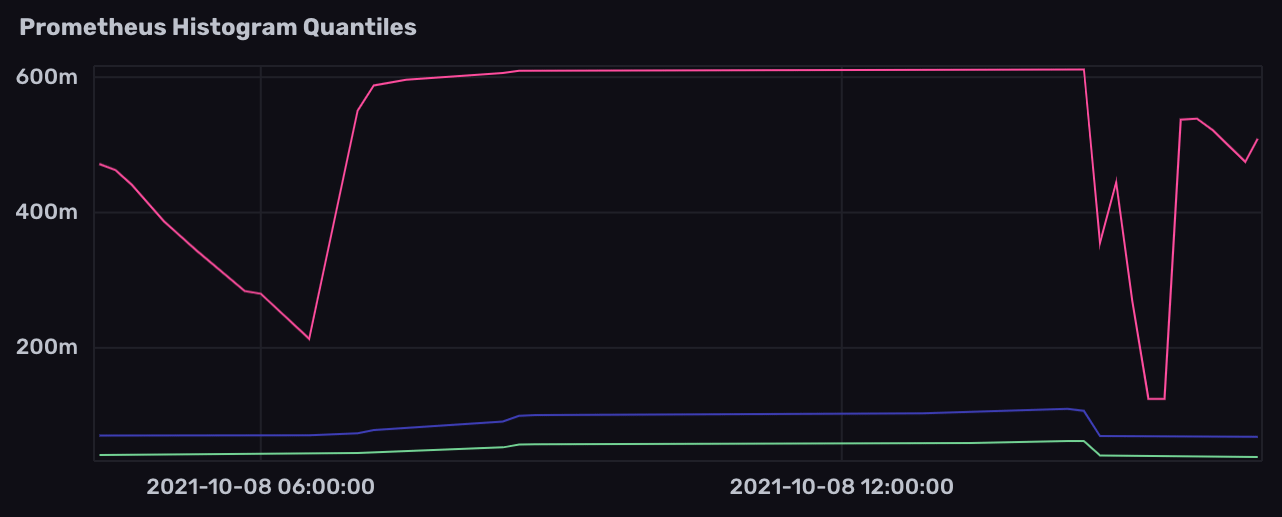
从 Prometheus 直方图计算多个分位数
- 使用 上面步骤 1-2(可选步骤 3) 查询直方图数据。
- 使用
union()联合计算唯一分位数的多个表流。
import "experimental/prometheus"

data =
    from(bucket: "example-bucket")
        |> start(range: -1h)
        |> filter(fn: (r) => r._measurement == "prometheus")
        |> filter(fn: (r) => r._field == "qc_all_duration_seconds")
        |> aggregateWindow(every: 1m, fn: mean, createEmpty: false)

union(
    tables: [
        data |> prometheus.histogramQuantile(quantile: 0.99),
        data |> prometheus.histogramQuantile(quantile: 0.5),
        data |> prometheus.histogramQuantile(quantile: 0.25),
    ],
)
import "experimental/prometheus"

data =
    from(bucket: "example-bucket")
        |> start(range: -1h)
        |> filter(fn: (r) => r._measurement == "qc_all_duration_seconds")
        |> aggregateWindow(every: 1m, fn: mean, createEmpty: false)

union(
    tables: [
        data |> prometheus.histogramQuantile(quantile: 0.99, metricVersion: 1),
        data |> prometheus.histogramQuantile(quantile: 0.5, metricVersion: 1),
        data |> prometheus.histogramQuantile(quantile: 0.25, metricVersion: 1),
    ],
)
此页是否对您有帮助?
感谢您的反馈!